Tag: carbon footprint

How to avoid ‘double counting’ your carbon

Carbon accounting is a fast-moving space, and here at FCT, keeping on top of best practices is one of our top priorities. We commission regular external reviews of all our emissions factors to make sure we’re as compliant and up-to-date as possible. And yet even with the best data available, there’s always the possibility of human error (we all do it!) cropping up in a carbon report. 

One area we’re particularly keen to address is how to avoid ‘double counting’ when it comes to farming footprints. This refers to counting the same carbon/CO2e in different places, often (but not always) in the same report. 

For example, you might record all your freight and logistics fuel use in the ‘Fuels’ section of our Calculator, only to duplicate the entry under the ‘Distribution’ section. This would result in counting the same emissions twice, artificially inflating the total emissions figure. 

These errors can be subtle and easy mistakes to make, so it’s worth reading on to find out how to avoid them and embrace best practices.

How is double counting possible?

Our Carbon Calculator has many different emissions factors that you can record, reflecting the wide variety of needs and business profiles in modern farming. Because of the need for informative metrics and KPIs, our Calculator sometimes offers the option to record an emission or offset in more than one section. 

You can therefore choose to either record all of the carbon in one section, or to split it out for better insight in your final report. For example, you may want to be able to see the amount of fuel used in farming operations vs. the fuel used in the distribution of goods. Being able to record the carbon in more than one place is crucial to business insight, but it does introduce the risk of error. 

If we want to use these informative metrics, then it’s important to be aware of when you might double-count your carbon. 

Where in the Calculator might I be double counting?

We’ve listed below some of the most common areas where double counting may occur in our Calculator. For each one we’ve given an example of how it occurs, and the best practice in order to avoid it. 

Animal Feeds – Home grown vs. Bought in 

If you are growing your own animal feed on-farm, then you don’t need to account for this in the ‘Livestock’ section. To do so would overestimate your emissions. The Livestock section is only for feeds that are specifically bought in.

To avoid the double count: Make sure that anything recorded as a feed in the Livestock section is a bought-in feed. If not, it doesn’t need to be counted there!

Materials vs. Inventory

The Materials section of our Calculator allows you to record a wide variety of items that are used in construction and repair work. Our Inventory section, on the other hand, is there to record larger capital items such as new outbuildings or farm machinery. This difference is key, as any items within the Inventory section will have their carbon impact depreciated over a period of 10 years.

It’s also possible to record your own custom building projects inside the Inventory section. For example, you might choose to record all the materials associated with a new outbuilding. This might be done so that you can achieve a more precise footprint for a non-standard construction. 

Where materials are purchased for running or regular repairs of existing installations, record these in the Materials section.

To avoid the double count: Make sure you’re not recording any custom-build projects in both Materials and Inventory. They only need to be recorded in one of these sections!

Sequestration – Double Counting Offsets 

If you have previously sold any carbon offsets, for example through soil organic carbon sequestration, then you should not count the offset in your report. To do so would be an example of double counting as the benefits are no longer attributable to your farm business. 

To avoid the double count: Make sure you’re only recording potential sequestration that hasn’t been sold or accounted for elsewhere. 

Sequestration – Double Counting potential sequestration

If you have entered an area of land under the sequestration option: “Soil Organic Matter” or “Soil Organic Carbon” (using information from soil sampling), you should not also enter those areas of land under other sequestration options (such as Countryside Stewardship Schemes, even if the land is receiving payment for that scheme). Direct soil sampling is preferable in this scenario. Similarly, whilst in practice you can “stack” the payments you receive from stewardship grants, you must only enter areas of land for sequestration under one potential sequestration option (so if “My field” is 5ha, I can enter soil sampling data from those 5ha OR the fact that they are under a Countryside Stewardship Scheme).

To avoid the double count: Include each field area under only one potential ‘Sequestration’ option.

Fuel Use – Distribution vs. Farming Operations 

If you want to split out your fuel use into distribution and farming operations, you have the option to record these separately. Any farm fuel use such as red diesel can be recorded under ‘Fuels’. Any fuel used in moving goods can be put under ‘Distribution’. 

To avoid the double count: We recommend splitting out fuel use between ‘Fuels’ (i.e. farm operations) and ‘Distribution’.

The Exceptions

As with all good rules, there are some apparent exceptions:

  • you CAN add multiple crops that have been grown on the same area of land in the same year (but only include those that have been harvested or terminated within the reporting period). 

How to get an accurate farm carbon footprint report

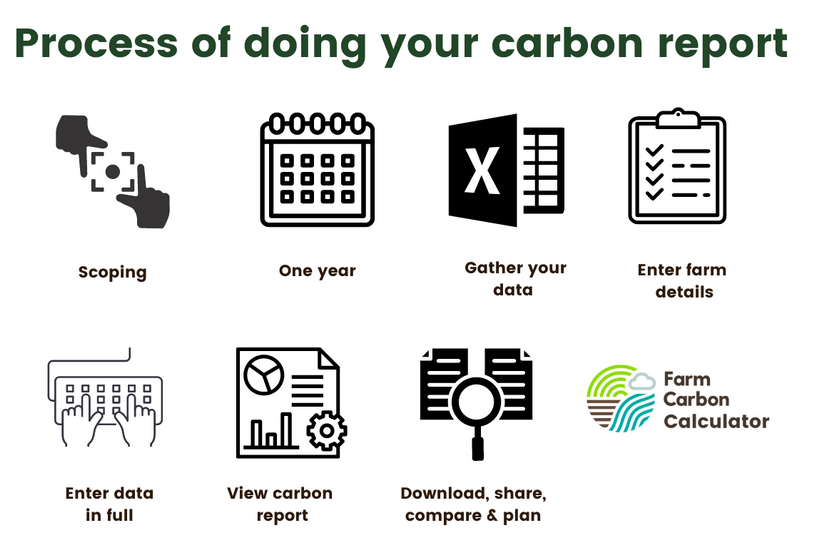
Process of doing your carbon footprint report

When calculating the carbon footprint of a farm business, users should expect a result that is accurate, insightful, representative and replicable. However, farmers and growers can sometimes be unsure what the results from different carbon calculators mean, and why they are different. In general, it is good practice to find a carbon calculator which works for you and stick with it. Many calculators provide their methodology which demonstrates transparency and is a feature which users should look for.  In this blog we walk you through the process, and what affects the reports produced.

Inputting data into Carbon Calculators

Before starting the process of collecting data from your farm business, scoping is an important first step in understanding what’s in and what’s out of the report. For instance, a farm might have different enterprises, such as arable farming, a farm shop and some business units. Reporting on those enterprises separately makes sense from the perspective of understanding the carbon footprint of farming operations. In many instances, it is important to understand who the report is being completed for. Completing a whole farm footprint ensures that no details are overlooked and enables users to estimate farm carbon removals as well as emissions. However, increasingly the customers of farmers and growers are keen to understand the emissions associated with the products they are buying.

It should be noted, however, that producing separate reports that focus on the product can lead to overlooking important parts of a farm as a system – those parts of the farm that keep the system working but don’t directly result in a product.

Time period for the report 

This is generally over a 12-month period and can coincide with business accounting or harvest year, whichever is most convenient. It is perfectly possible to carry out emissions reporting over shorter periods to coincide with, for example, batches of livestock production. If you take this approach, be sure not to leave gaps between your reporting.

Data collection is a key part of the process and is generally undertaken by the business owner/employee. Getting this right is critical, and the quality of the data going in directly affects the accuracy of the results that come out. Our advice is quite simple – collect as much data as possible that is relevant to your business over the period to be reported on. We have a data collection spreadsheet to help with this part of the process https://calculator.farmcarbontoolkit.org.uk/resources

When entering data into the Calculator, it is important to ensure that data is entered correctly and in full. Users need to ensure that they’ve inputted everything collected in the data collection process and that units, decimal points and other important information are filled in correctly. There is much potential for error here, which will have a significant impact on the results!

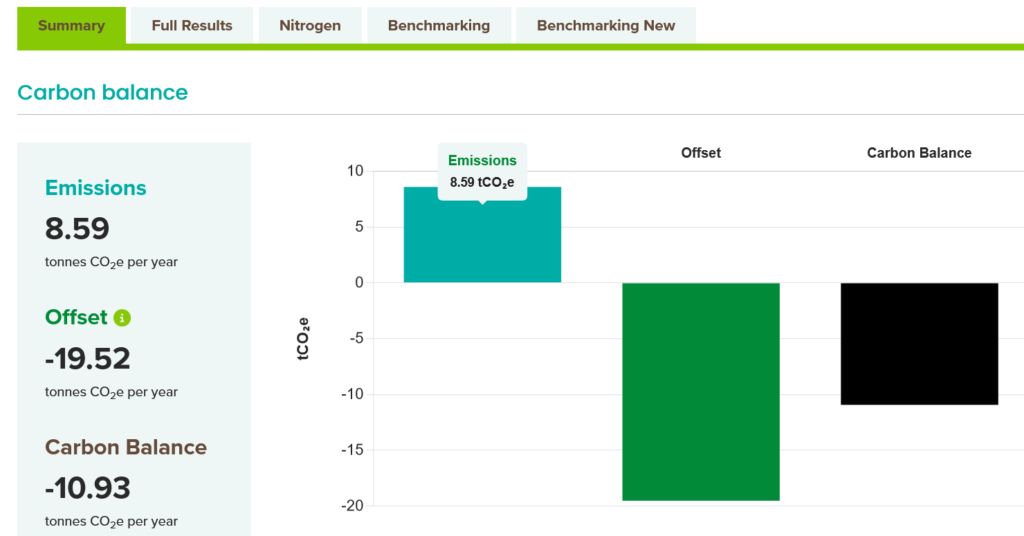
Once data is entered and results can be viewed, interpretation of the report is very important. Is the report looking at a whole farm or enterprise footprint? Are you looking at the emissions only or the carbon balance? Are results being shown per hectare, per tonne, or for the whole business? Being clear about what has been measured, and what is being reported is crucial – particularly if comparing between different businesses or within a sector. 

Getting our bit right

As a provider of a leading carbon calculator for farmers, growers and food businesses, at Farm Carbon Calculator we take a huge amount of care in ensuring that we are getting our numbers right. 

Alongside your farm data, all Calculators will have a series of formulae and emissions factors which are used to calculate the farm’s emissions. Emissions factors tell us how much greenhouse gas is released from a certain activity – for instance using a litre of diesel in a tractor. At FCT, we do this on thousands of items! We update all our emissions factors on an annual basis, and sometimes more frequently if new and credible research comes along. 

Once we’ve entered the new emissions factors, which have to be backed up by rigorous and credible peer-reviewed science, we then test the Calculator to ensure that everything is working properly. This process is rigorous and any anomalies are corrected before the update goes live. We publish our methodology and references on our resources page. The next update is due in April 2024.

This ongoing process ensures that we are on top of the science, up-to-date, and maintaining a tool that users can expect to get accurate and reliable results from, in order to make informed decisions for their business.

Alongside getting the factors and formulae correct, there is increasing guidance on what needs to be included within any agricultural greenhouse gas audit and how the calculations should be completed. Examples of such guidance come from the draft Land Sector Removals guidance from GHG protocol which sets standards for how GHG accounting should be carried out and the Forest, Land and Agriculture Science (FLAG guidance) from the Science-based Targets Initiative (SBTi). At FCT, our Calculator has been analysed against the requirements of FLAG and our Calculator has been found to be well aligned with its requirements.

As an organisation that exists to help farmers and growers measure, understand and reduce their carbon footprint,  we always operate in the best interests of our users which includes ensuring our Calculator is as accurate as possible at all times. We are independent, providing a free carbon calculator for farmers and growers, and have a process of continual improvement in place. As a regular user of our Calculator you can always compare current and past results using the most up-to-date Calculator, allowing you to track business progress to net Zero.

You can find all you need to know about the Farm Carbon Calculator here If you need more information please contact us at [email protected] or phone us on 07541 453413 

In the next blog we focus on how we get externally reviewed, and are engaged with industry and Government to improve accuracy and standards.

Silage with Dave Davies – 16th November 2023

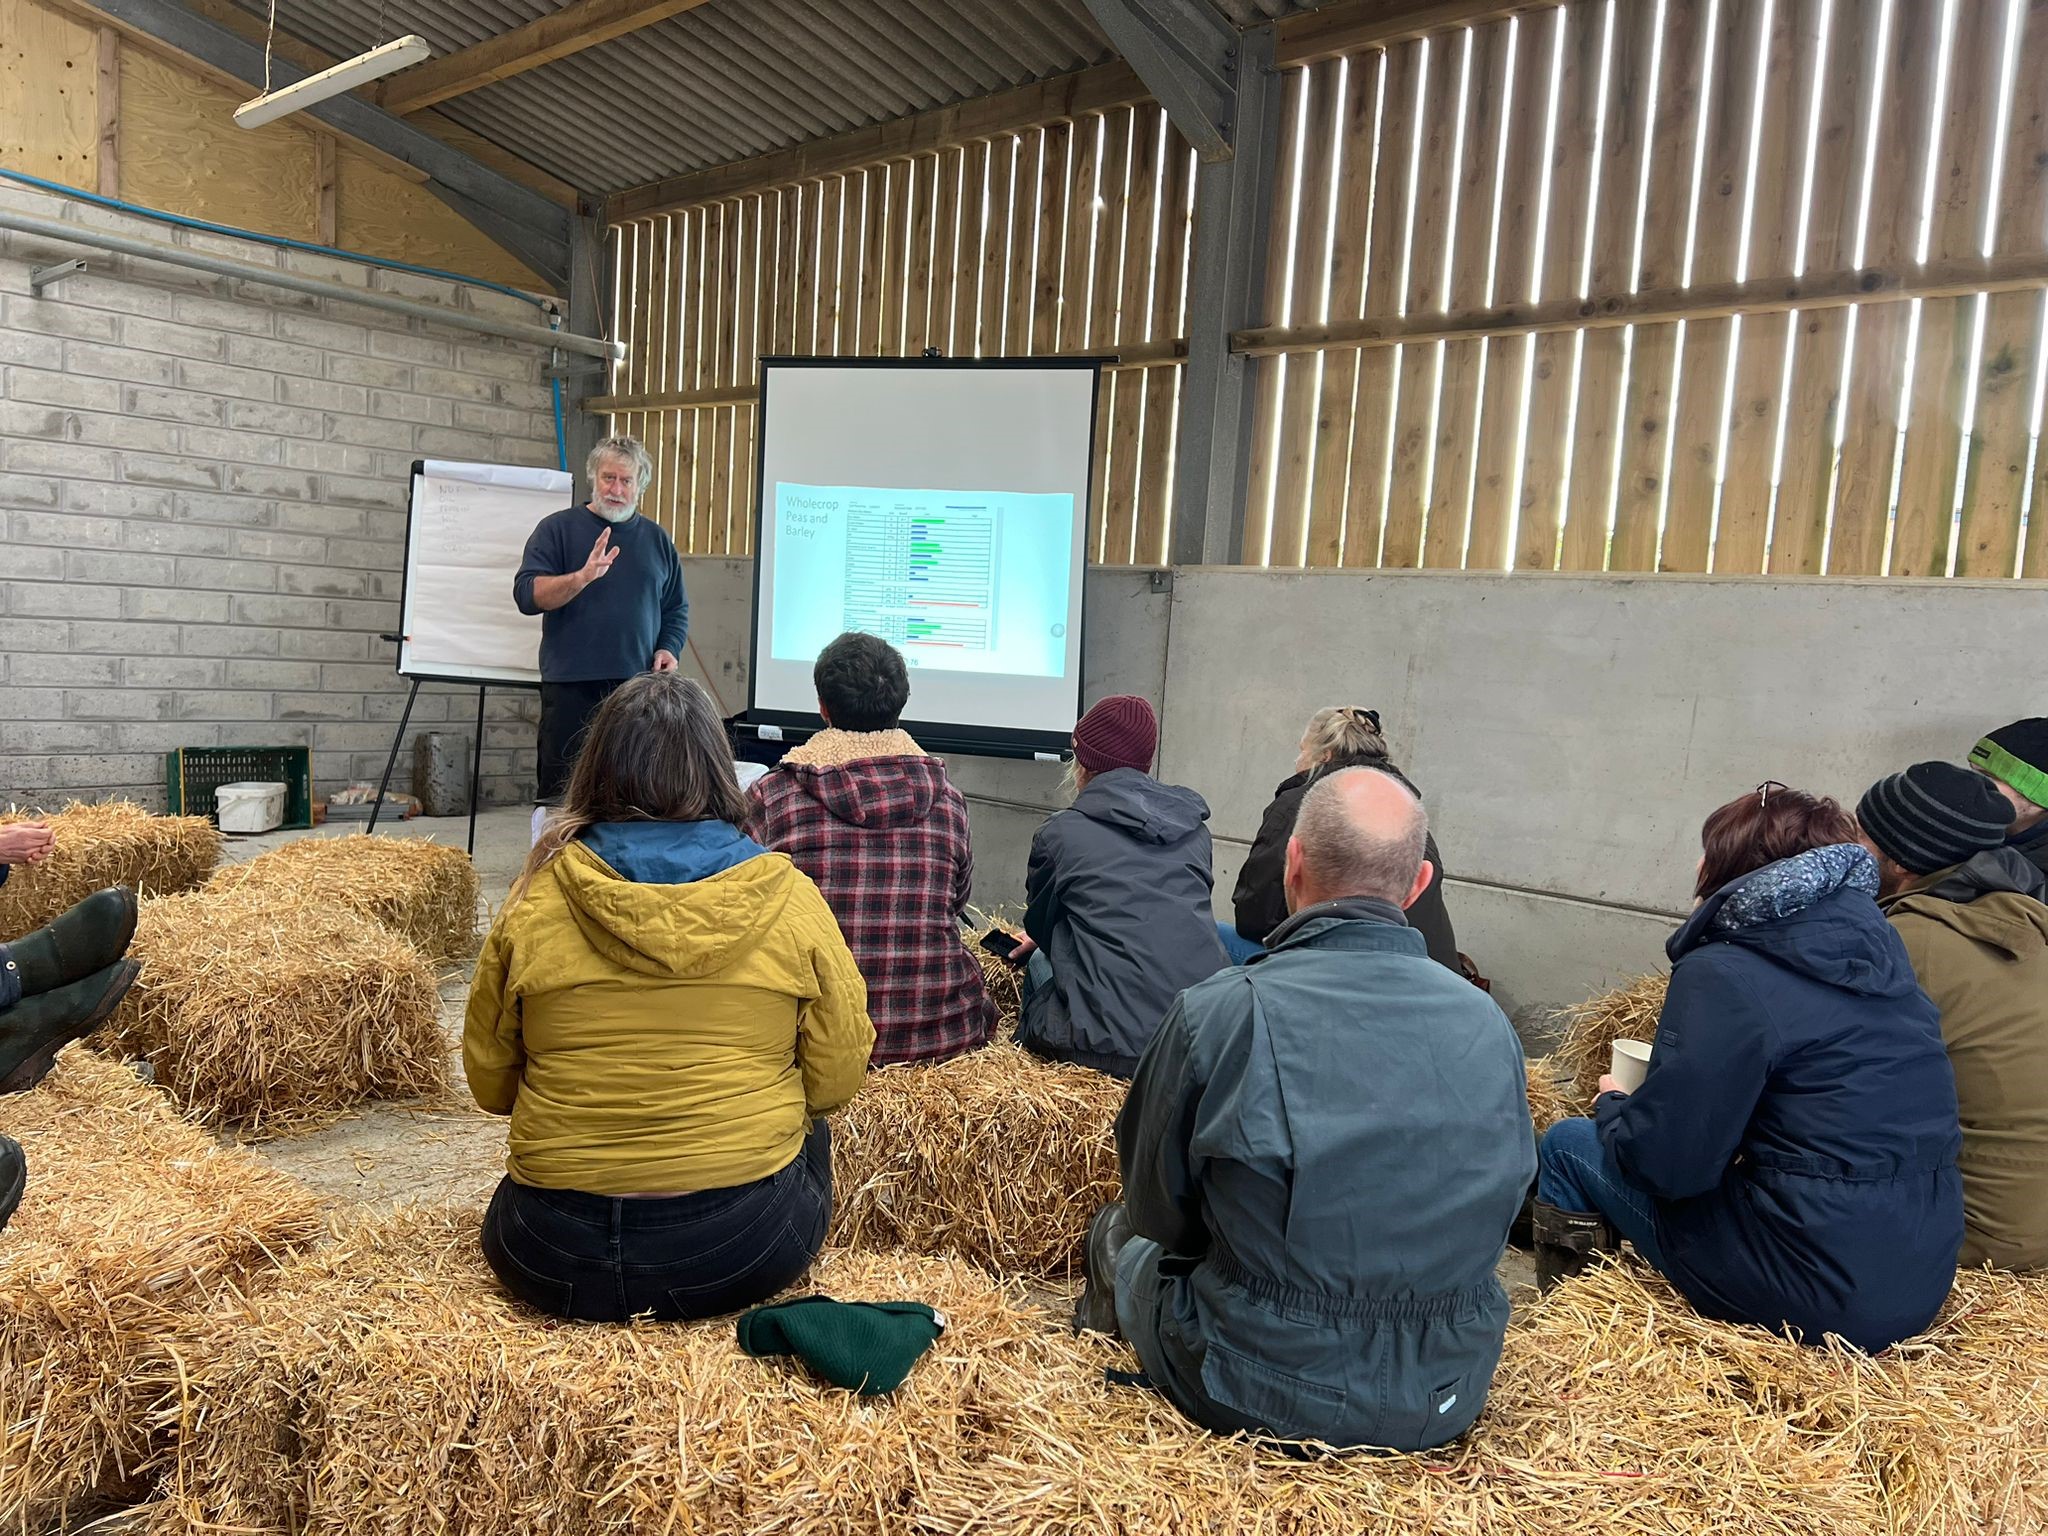
Improving the quality of homegrown feed is an important consideration for farms looking to reduce their carbon footprint. Dr Dave Davies from Silage Solutions Ltd spoke about optimising silage production and quality at Farm Net Zero Monitor Farmer, Phil Kent’s, Higher Carruan dairy unit. This event was made possible with thanks to the National Lottery Community Fund who fund the Farm Net Zero project.

Dave recommended that the best forage for silage production is young, highly digestible material under a multi-cut regime. This is easier to make into high quality silage than older material, and because it has a higher feed value can help to reduce emissions associated with bought-in feed, as less is required when homegrown forage is improved.

Dave explained that the ideal dry matter for silage is 30-32%, this should be achieved by wilting rapidly and for no longer than 36 hours. When making clamp silage, grass should be layered in at 15cm depths as this is as far down as effective compaction occurs. Side sheets should be used, along with a cling film barrier and then a top sheet. There should be pressure all over the clamp, and especially at the sides where ideally gravel bags should be overlapping. The aim is to seal in carbon dioxide to create anaerobic fermentation and prevent any oxygen entering. For bales, a chopper baler is best and ideally bales should be wrapped at the stack to avoid puncturing the wrap. Bale handlers are better than spikes for the same reason.

Silage with an appropriate dry matter will increase the amount of lactic acid compared to acetic, which is good because lactic acid helps to lower silage pH and prevent dry matter and energy losses. A higher proportion of lactic acid is also important because it locks up hydrogen molecules that can otherwise form excess methane in the rumen. This excess methane is an energy loss for the animal, as well as a greenhouse gas emission.

In the UK, average losses between mowing and feeding out silage can be 25% for clamps and 10% for bales. This waste is obviously a financial cost to the farm, both from the money lost making waste silage and from the cost of buying replacement feed. But it also affects the farm’s carbon footprint per unit of feed, because there are carbon emissions associated with using diesel to make this lost silage. By focusing on methods of reducing waste, a farm can increase the amount of silage it gets for the same amount of diesel used.

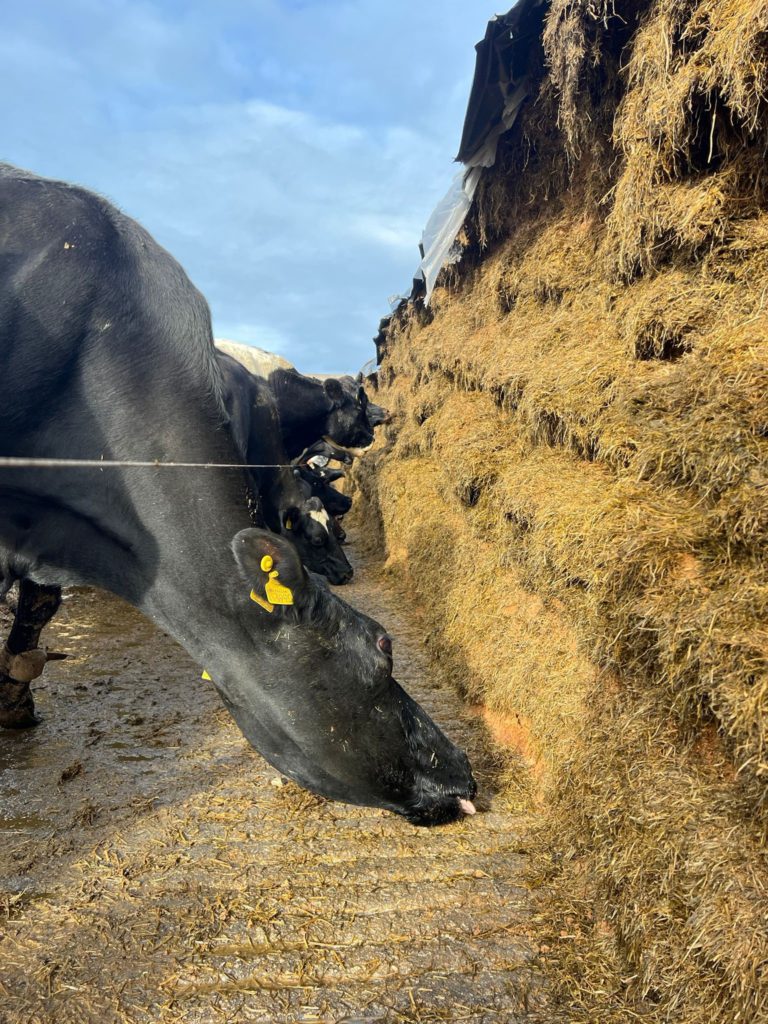
Phil Kent then took the group to see the self-feed silage clamp. Phil and his team milk 300 autumn-calving Friesian-type cows on a grazing system, supplying milk for a cheese contract. Three cuts of grass/herbal ley silage, plus wholecrop peas and barley were put into a clamp measuring 80 metres by 20 metres, aiming to fill to a height of 2 metres.

By allowing the cows to feed straight from the clamp face, Phil is reducing the amount of diesel used over the winter. This has a corresponding reduction in carbon emissions compared to using machinery to carry the silage to the cows.

Key takeaways:

  • Reducing waste in silage production reduces the carbon footprint per unit of feed
  • Improving the quality of homegrown feed reduces the need for bought-in feed
  • Self-feed silage clamps can have a lower diesel requirement, with lower emissions.

Our latest upgrade to the Farm Carbon Calculator

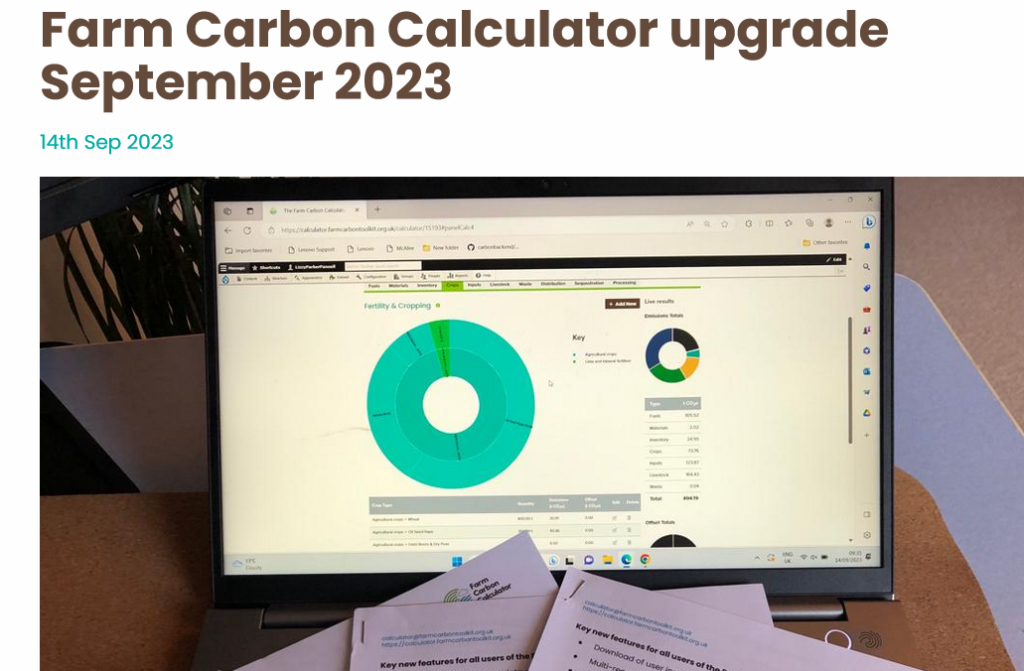
Today the Farm Carbon Calculator has gone live with a major upgrade. As part of our development cycle, every few months we deliver updates to ensure our calculator keeps up with the latest science, while also improving its features and usability. As the number of users continues to rise, we  regularly  update the tool to ensure it’s the best it can be and matches our users’ expectations.

The recent COP26 exemplified how carbon has shot up the agenda for everyone in societies across the world, and this fact is reflected in the number of farmers and growers we are engaging with at the Farm Carbon Toolkit. We have been advocating for over ten years that farmers and growers have a key role in cutting emissions and indeed in sequestering carbon in their biomass and soils, and we provide solutions for users to measure and manage carbon in their businesses. 

Farms are one of just two industrial sectors that can not just reduce emissions but also sequester carbon (the other being forestry). This means farming can play a positive role in the climate crisis by potentially drawing down atmospheric CO2 into its soils and biomass. Facing the climate crisis, we are here to support farmers and growers to make a positive contribution, as we all must do.

What’s changed

In this upgrade we have updated a wide range of emissions factors based on the latest research; including in Fuels, Livestock, Fertilisers, Crops, and Materials. This means up-to-date figures, more categories and therefore increased accuracy.

Major changes include a larger range of fertilisers, a huge range of branded sprays to choose from, a new way of recording livestock numbers – giving much more useful outputs, more animal feeds, new animal bedding section, a much greater range of bought in manures, and upgraded factors in fuels, electricity and travel.

There are new user features including an improved way of recording yields of crops, more FAQs to help you through the process, and videos to support you in filling in the Calculator.

On the Report Summary page, the emissions are now broken down into Scopes 1, 2 and 3, which makes Company Reporting easier and clearer. We’ve also separated results for carbon dioxide, methane and nitrous oxide, so users can understand which greenhouse gases make up their total carbon footprint. 

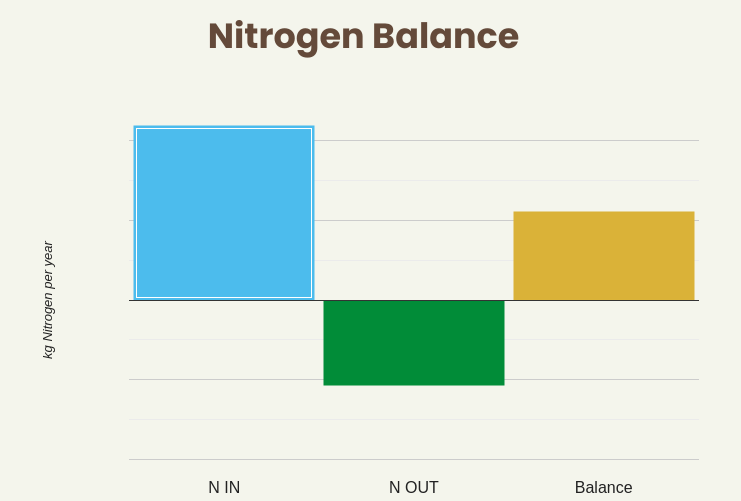
A brand new feature, and a great compliment to Carbon, is a way to measure Nitrogen. Thanks to funding from the WWF, and in conjunction with the Soil Association, our new ‘Nitrogen Module’ allows users to visualise the nitrogen flows in and out of their farm system. Nitrogen (N) inputs are built up from biological fixation, synthetic fertilisers and organic manures as well as purchased livestock and animal feeds. The N output is calculated from in-field N2O emissions as well as crops, milk and livestock sold and the N balance calculation provides an overview of the net change of Nitrogen over the year. 

The new Nitrogen Module shows overviews and details of the flows of N in and out of the farm

The process

It takes several months of work to prepare for an upgrade. We plan, prioritise, research, extract figures, build new functionality, review, then test, test and test again! 

The Calculator team is already planning the next update, which is scheduled for late February 2022. We will be working to update a raft of more emissions factors, reviewing the latest science (which is changing quite rapidly), and working on even more user features. Which all means that in another three months the Calculator will take an even bigger leap forward!

The Calculator can be used on all types of farms, including livestock, arable and horticulture

Working with consultants, larger companies and organisations

The Calculator will always be free for farmers and growers to use. But increasingly we have a new group of users who want to use the Calculator within their supply chains and as part of a consultancy service. 

For consultants advising farmers, we offer a licensing service, where they can receive training and access to the Calculator to calculate the carbon footprint of their clients, and deliver advice upon the results. For businesses and organisations managing groups of farmers and growers – such as buying groups, co-ops and larger food businesses, we offer a white label version of the Calculator. This is branded and tailored to the user, along with support from us, and a group admin function to manage and compare group users’ data.

Finding out more

We hope you find the Farm Carbon Calculator useful for your business, and take steps to reduce your carbon footprint. You can use the Toolkit for further help, advice and case studies https://farmcarbontoolkit.org.uk/toolkit

For help and advice on how to use the Calculator, visit our webpage https://calculator.farmcarbontoolkit.org.uk/ 

For information on commercial licenses and white label versions, please contact us [email protected]